Capnote – Geographic Exposure (Professional)
Discover Geographic Exposure
Discover geographic exposure in companies or portfolios through changing supply chains, company expansion or contraction, and geo-political events.


It is fair to say that many financial professionals and investors have a hard time keeping track of the geographies that are most important to their clients or investments. Changing supply chains, company expansion or contraction, geo-political events that create risk or opportunities make this essential task even harder for individuals.
Capnote’s automation and visualization technology helps by providing interactive maps that illustrate particular points of geographic exposure.
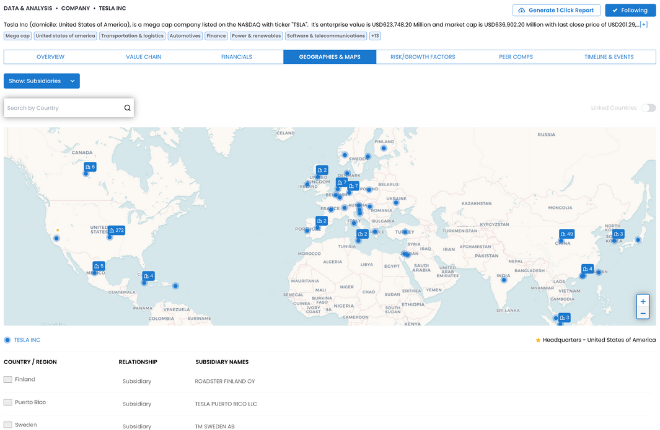
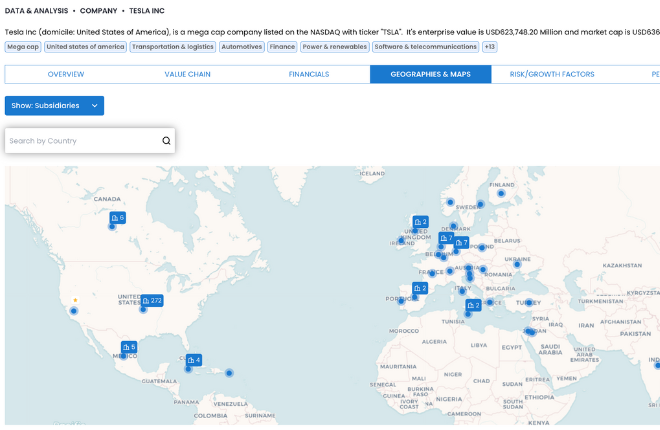
For example, Capnote provides an automated map showing the locations of subsidiaries of a company. This can illustrate locations of operations and sales for further investigation. See the example for Tesla.
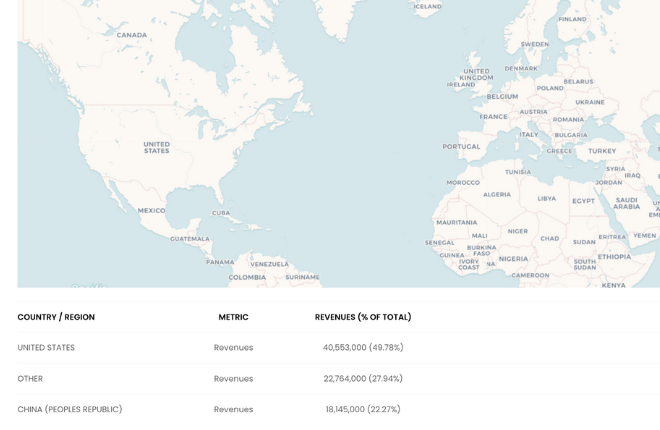
In addition, Capnote shows the geographic or category based revenue breakdown for companies that disclose that information. See the example of Tesla from a previous year.
For portfolios of companies, Capnote is able to overlay the geographic footprint for multiple companies to illustrate the potential geographic exposure of the portfolio.
Soon, Capnote will be able to let you add in additional geographic context for specific companies for your private use.
Stay tuned for more updates!


Testimonials
Here is what our users are saying...
I particularly like the value chains and ability to see the interaction between two or more companies.
Increase Your Financial Productivity Now
Join a growing community with thousands of financial professionals and investors from all over the world.
